Joining ASU and a peek into my research
My name is Nithyanandan Thyagarajan. I joined the LoCo (Low frequency Cosmology) lab group at ASU SESE headed by Prof. Judd Bowman, in September 2013 as a postdoctoral research scholar. I did my bachelor’s in Electrical Engineering from IIT Madras, India. For my PhD thesis at Columbia University, I worked on identifying and characterizing variable and transient radio objects by conducting one of the biggest searches of its kind in the radio sky. I then moved to Raman Research Institute in Bangalore, India as a postdoc and worked on statistical characterization of foreground contamination in the power spectrum of redshifted 21 cm line emission of neutral hydrogen during the epoch of reionization (EoR). During this period I got associated with the Murchison Widefield Array (MWA) project.
The LoCo group has members involved in a variety of interesting projects. Besides having a strong presence in the MWA project, the members are also involved in other EoR experiments using the Experiment to Detect the Global EoR Step (EDGES), Precision Array for Probing the Epoch of Reionization (PAPER), Dark Ages Radio Explorer (DARE), Long Wavelength Array (LWA) and other theoretical and modeling projects. I am excited to be a part of this diverse group which provides enormous opportunities to learn science through the many perspectives from these different experiments.
Currently, I am focusing on setting up simulations to predict the response of the MWA telescopes to all-sky radio emission. My aim is to isolate and characterize the signatures of different spatial structures of foreground objects such as the Milky Way, and other extragalactic objects besides the instrument’s own systematic effects on the observed power spectrum that contains information about the spatial distribution of redshifted 21 cm line emission from neutral hydrogen from the EoR. An understanding of the radio foreground objects and that of the telescope is extremely significant because the expected signatures from the neutral hydrogen emission during the EoR are extremely faint compared to the contamination from radio foregrounds and instrumental artifacts. Detecting EoR signal may be impossible without a precise removal of such contamination and artifacts.
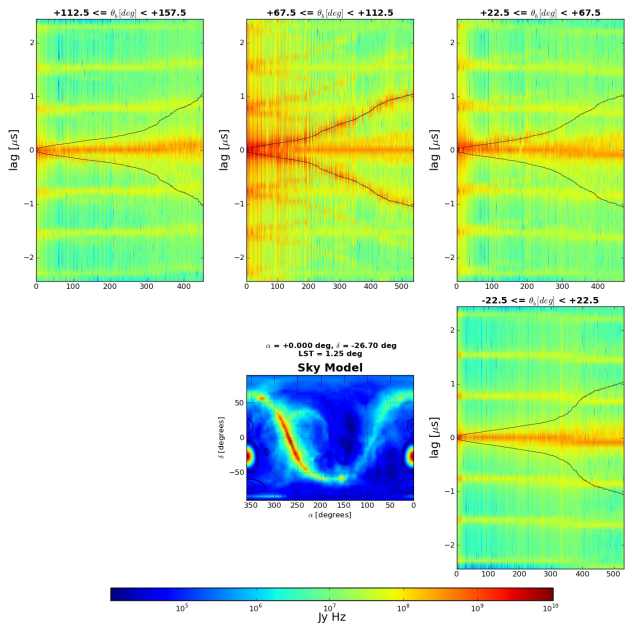
Here’s an approximate simulation of the radio foreground and instrumental signatures we expect to see in the power spectrum when the entire hemisphere of the sky is observed by the MWA telescope. The simulations are found to match well with results from analysis of data from the MWA telescopes.

Predicted spatial power spectra of an all-sky radio model of foreground objects as seen by MWA telescopes. The all-sky radio emission model is shown in the central panel. The peripheral panels show the power spectra recorded by different antenna pairs (x-axis) grouped by orientation of the lines joining them (EW at bottom right, NE at top right, NS at top center, and NW at top left). The x-axes in all the peripheral panels represent the different antenna pairs which sample the transverse spatial information from emission from the plane of the sky while the y-axes sample spatial structures into the plane of the sky. Since the sky model contains heterogeneous spatial structures, these different antenna pairs record different spatial information. The wedge/fork shaped feature prominent in the top center panel and the bright horizontal feature in all the peripheral panels arise out of the emission from our galaxy and other extragalactic radio emission (all the bright features enclosed by the forked black lines). The periodically repeated horizontal structures are caused by the frequency characteristics of the MWA telescopes.

Reply